|
Educational Inequalities of Today
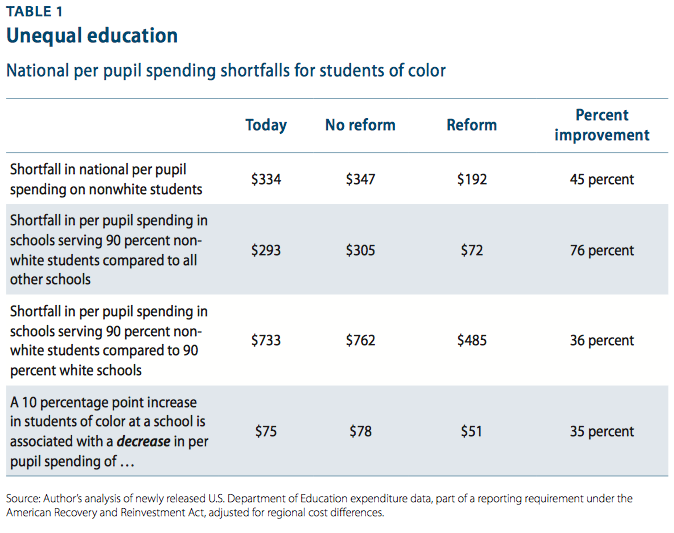
In 1954 the Supreme Court declared that public education is “a right which must be made available to all on equal terms.”1 That landmark decision in Brown v. Board of Education stood for the proposition that the federal government would no longer allow states and municipalities to deny equal educational opportunity to a historically oppressed racial minority. Ruling unanimously, the justices over- turned the noxious concept that “separate” education could ever be “equal.” Yet today, nearly 60 years later, our schools remain separate and unequal. Almost 40 percent of black and Hispanic students attend schools where more than 90 per- cent of students are nonwhite.2 The average white student attends a school where 77 percent of his or her peers are also white.3 Schools today are “as segregated as they were in the 1960s before busing began.”4 We are living in a world in which schools are patently separate. Table 1 presents a lot of important information. The most shocking is the data showing that schools with 90 percent or more students of color spend a full $733 less per student per year than schools with 90 percent or more white students.
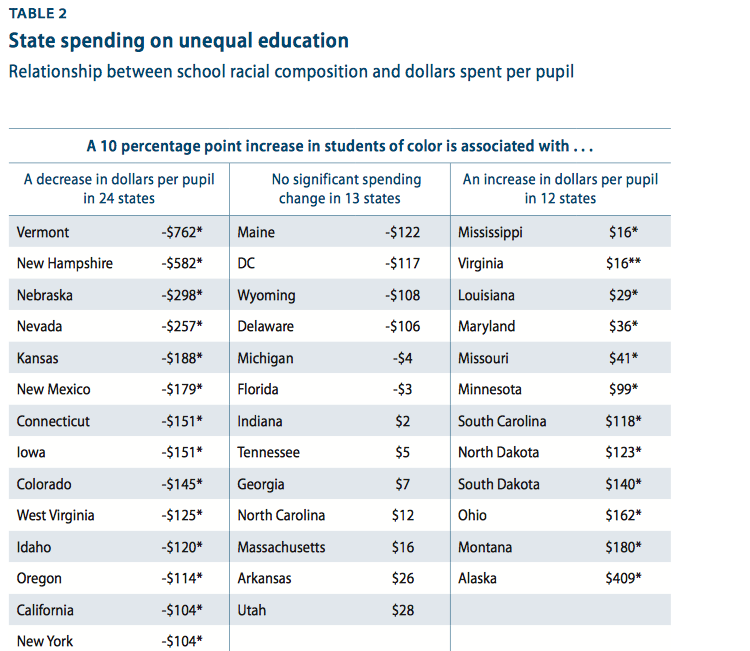
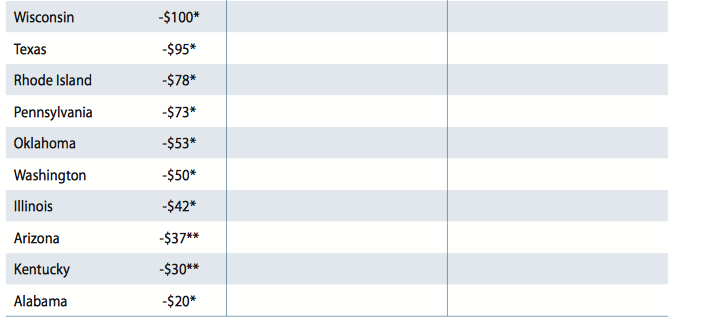
What does that add up to? On average, the high-minority schools have 605 students. This average school would see an annual increase of $443,000 in state and local spending if it were brought up to the same per-pupil spending level as those schools with very few nonwhite students. This is enough to pay the average salary for 12 additional first-year teachers or nine veteran teachers. Table 2 shows how an increase of 10 percent in students of color is related to per-pupil spending in each state. It shows that in 24 states an increase in the concentration of students of color is associated with a decrease in dollars spent per pupil. These 24 states educate 63 percent of all students of color. In 13 states the percentage of students of color is not related to a school’s per-pupil spending. In 12 states an increase in the concentration of students of color is associated with an increase in per-pupil spending. This positive news is tempered by the fact that only 12 percent of students of color attend school in these states. Finally, across all schools, an increase of 10 percent in students of color is associated with a decrease in spending of $75 per student.12 This is a fairly small number, given that the median per-pupil spending in 2009 was $4,038. This analysis does not imply that spending is being determined by race, explicitly or implicitly. But given the 20 percent gap in high school graduation rates between white students (78 percent) and their peers—Hispanic (58 percent), black (57 percent), and American Indian (54 percent)—spending less money on schools that serve more students of color, even if it is not on purpose, simply does not make sense.13 |
Video: Brown v. Board of Education: Jim-Crow Segregation 60 Years Later
|
Citations:
1. Spatig-Amerikaner, Ary . "Unequal Education Federal Loophole Enables Lower Spending on Students of Color." Center for American Progress. http://cdn.americanprogress.org/wp-content/uploads/2012/08/UnequalEduation.pdf (accessed October 9, 2014).
2. YouTube. "Brown vs. Board of Education: Jim-Crow Segregation 60 Years Later." YouTube. https://www.youtube.com/watch?v=f9VuE2SSAfU (accessed October 10, 2014).
